TWS Release Notes
MiFIR Transaction Reporting
TWS and the API now support MiFIR reporting. In TWS:
- Define a default decision-maker and execution trader for both TWS and the API in Global Configuration;
- Specify decision-maker on a per-order basis in Mosaic Order Entry, and Classic order line and order ticket.
Set Defaults in Global Configuration
You can define default TWS and API decision-maker and execution trader values in Global Configuration for MiFIR reporting. To access these settings, in TWS Global Configuration go to Orders and then select MiFIR. Define the following default values:
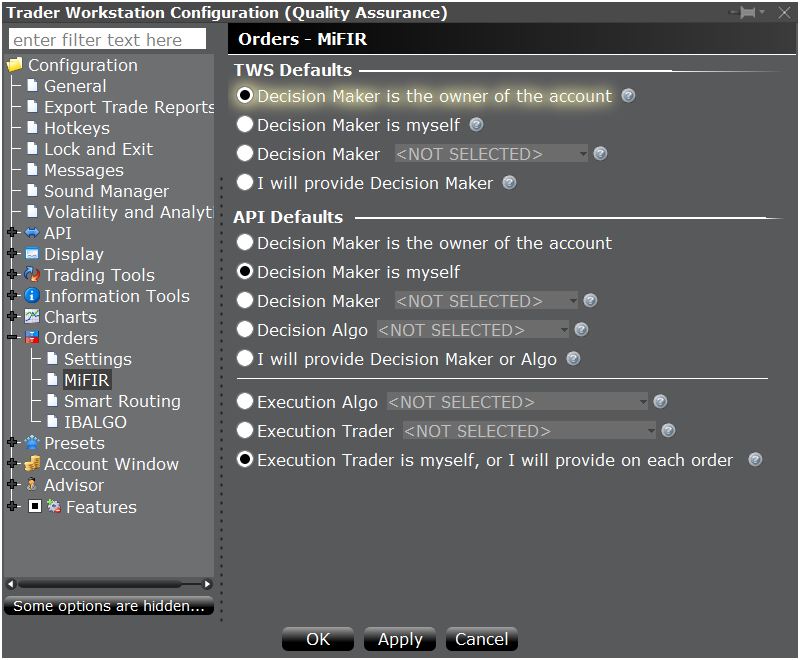
TWS Defaults
- Decision Maker is the owner of the account - The account owner will be named as the default decision-maker for all orders submitted via TWS.
- Decision Maker is myself - You, the trader, will be named as the default decision-maker for all orders submitted via TWS.
- Decision Maker: - Select a decision maker to use as the default. Choices are those that were defined in Account Management.
- I will provide Decision Maker - No default decision-maker will be named; you must define a decision maker on a per-order basis.
API Defaults
- Decision Maker is the owner of the account - The account owner will be named as the default decision-maker for all orders submitted via the API.
- Decision Maker is myself - You, the trader, will be named as the default decision-maker for all orders submitted via the API.
- Decision Maker: - Select a default decision maker to use as the default. Choices are those that were defined in Account Management.
- Decision Algo: - Select a default decision algo to use as the default. Choices are those that were defined in Account Management.
- I will provide Decision Maker or Algo - No default decision-maker or decision-algo will be used by default; you must define one on a per-order basis.
Execution Defaults
- Execution Algo - Select a default executing algo to use as the default. Choices are those that were defined in Account Management.
- Execution Trader: Select a default executing trader to use as the default. Choices are those that were defined in Account Management.
- Execution Trader is myself, or I will provide on each order - No execution trader or algo will be used by default; you must define one on a per-order basis.
TWS Per-Order Decision-Maker Selection
You can specify a decision-maker or change the default on a per-order basis from the Mosaic Order Entry panel, the Classic order line, or the Order Ticket.
From Mosaic Order Entry, use the advanced panel to display the decision-maker drop-down. If you defined a default selection in Global Configuration, that value is displayed; if you did not set a default, the field displays "NOT SELECTED" and you must define a decision-maker for the order to be accepted.
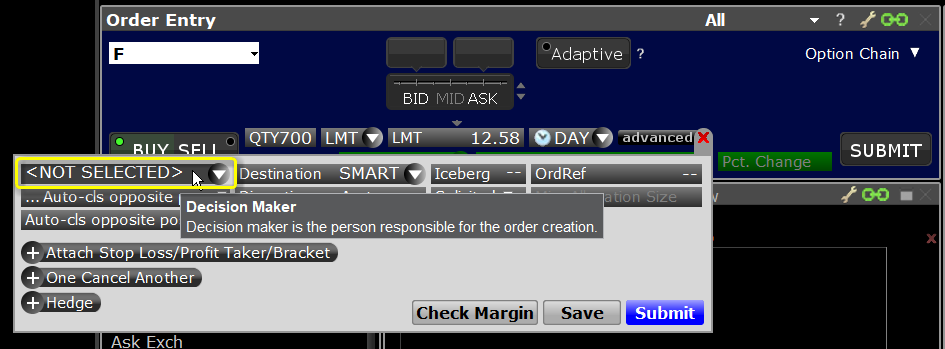
From the Classic TWS order line, use the Decision-Maker field drop-down to make a selection. If you defined a default decision-maker in Global Configuration, that value is displayed; if you did not set a default, the field displays "NOT SELECTED" and you must define a decision-maker for the order to be accepted.

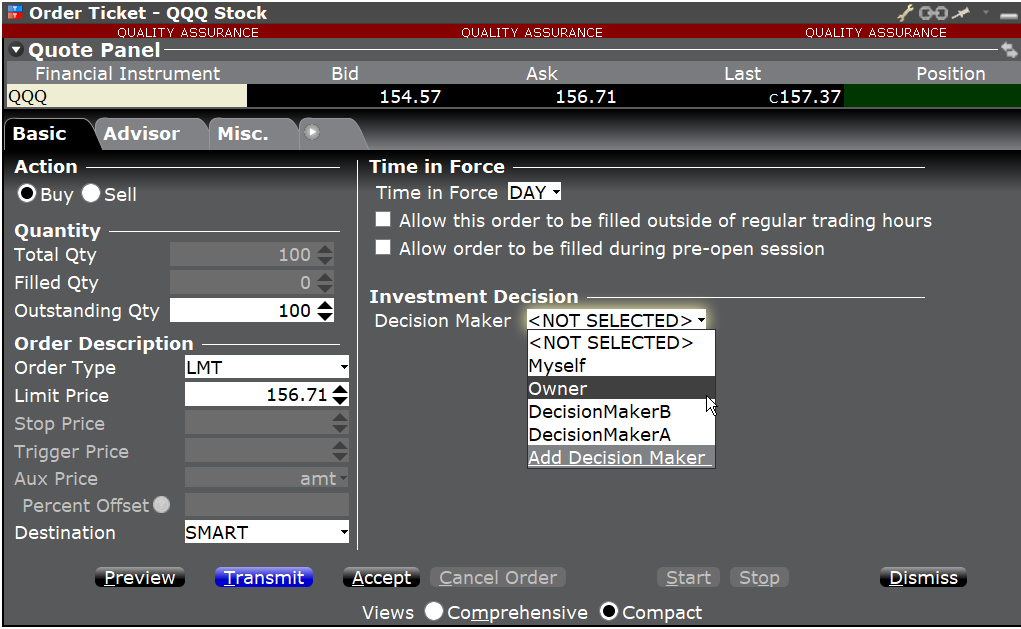
From the TWS Order Ticket, select or change the decision-maker from the Investment Decision section of the window. If you defined a default decision-maker in Global Configuration, that value is displayed; if you did not set a default, the field displays "NOT SELECTED" and you must define a decision-maker for the order to be accepted.
For more information about MiFID, see the Overview of MiFIR Transaction Reporting page.
New Intraday VWAP Study Added to Charts
We have added a new Intraday Volume-Weighted Average Price (Intraday VWAP) study to our charts. This study tracks VWAP throughout the day, and displays as a colored line linking VWAP values at varying times throughout the one-day period. By default, the line that tracks Intraday VWAP is bracketed within a high/low standard deviation range. The standard deviation is calculated for the same period as the VWAP, and the range can be adjusted by modifying the number of Standard Deviations within the settings of the Intraday VWAP.
Intraday VWAP is calculated as: VWAP=[sum (Volume_bar_i * Typical_price_i)]/sum(volume_bar_i) where i is the intraday bar number. If we use a 1 min daily bar chart, the calculation is made from the first minute with i=[1;N] where N is the last bar number of the chart, Typical_price_i = VWAP_on_bar_price_i => This is the VWAP we currently store and volume_bar_i is the volume for the bar i. If no volume is available for the product (i.e. for IND, CASH and CMDY), use 1 as volume for each bar.
Add this study from the Volume Studies section of Chart Studies. Additionally, display the bar VWAP by checking VWAP of the bar found in the Additional Parameters and Features section of the Chart Parameters page.
Note that the Intraday VWAP study is only valid on charts with access to the data points needed to calculate it, specifically high, low, close and volume. Choosing "Trades" as the What to Show parameter always provides these data points.
IBot Efficiently Handles Bond Queries
IBot can now understand and process most common government and municipal bond queries. Ask IBot to buy, chart, view and quote bond contracts, by ISIN, CUSIP for all bonds (US government, foreign government, municipal and corporate) or by contract name for all US government bonds. Enter requests in normal language, such as “buy 3-month t-bill,” “chart US-T Bill Jan25'18 for 1 week with hourly bars", “show ten year treasury bond”, “buy 043771ES9 bond” and “show 30y treasury bond.”
To use IBot, from the New Window drop down in Mosaic select “IBot – type to trade.” Enter commands in the text entry field and hit Enter to submit.
To find out more about IBot, see the IBot feature page.
IBot: Help Manage Your Account
IBot can now help you complete tasks that require log-in access to Account Management (AM). When you ask IBot about funding, reports, market data and other AM-related tasks, IBot recognizes these requests and opens the relevant AM page for you in your web browser. For example, to fund your account you could enter: “Fund my account” and IBot will open Account Management in your browser window to the correct page. IBot can put you where you need to be for many AM tasks, like depositing and withdrawing funds, viewing PortfolioAnalyst reports, accessing Activity Statements, and making changes to your market data subscriptions.
Some of the Account-Management related commands IBot can help with include:
Funding
- withdraw funds from my account
- Deposit funds
- Deposit money
- Deposit $1000
- Transfer cash
- wire
Trading Permissions
- Update my trading permissions
Trade History
Depending on how far back you want to go with your trade history, IBot will determine whether to show you a list of your recent trades, bring you to the TWS Trades Activity window, or open the Trade Confirmations section of Account Management.
- Recent trades
- Trade confirmations
- trade log
- See my trade history
- trade history
- Previous trades
- Show me this week's trades
PortfolioAnalyst
- Portfolio Analyst
- Custom benchmarks
Activity Statements
- Show my P&L history
- account summary
- MTM summary
- Realized summary
Market Data
- change market data subscriptions
- subscribe to...name of provider
- Subscribe to live data for ...name of symbol
- Do I subscribe to live data for ...name of symbol
To find out more about IBot, see the IBot feature page.
IBot Takes Its Next Steps!
As we continue to enhance IBot's power for your benefit, you will start to notice that the "Next Step" actions you are offered after a command become more and more useful to you. IBot is keeping track of the most popular "next step" actions, and as it learns it will offer these to you at the top of the list to make your trading experience even more efficient.
For example, if you ask to see the price of AAPL, the current next steps might be Show Chart, Buy, Sell, Tell me more. After collecting data of most popular next steps following a price inquiry, the next steps might change to be Buy, Show Chart, Show Analyst Rating, Tell me more.
New Utilization Column in TWS
A new Short Selling column for stocks and ETFs, Utilization, is now available in TWS. This value, displayed as a percentage, is the ratio of “shares lent” to “shares available,” and illustrates the general level of demand for an asset. The Utilization percentage is calculated as:
Number of shares loaned (across all outstanding loans) ÷ number of shares available to loan (from lending agents)
The utilization ratio provides insight into the potential value of shares you own, and may be especially useful to IB clients who participate in the Stock Yield Enhancement Program, or are considering doing so. Theoretically, the larger the Utilization percentage, the greater the demand for the asset.
To add the Utilization column, hold your mouse over an existing market data column and click the Insert Column pop up. Scroll down to the Short Selling category and select Utilization.
Visit the Securities Financing page to find out about the benefits of lending shares you currently own via IB’s Stock Yield Enhancement Program.
TipRanks Analyst Rankings in TWS Fundamentals
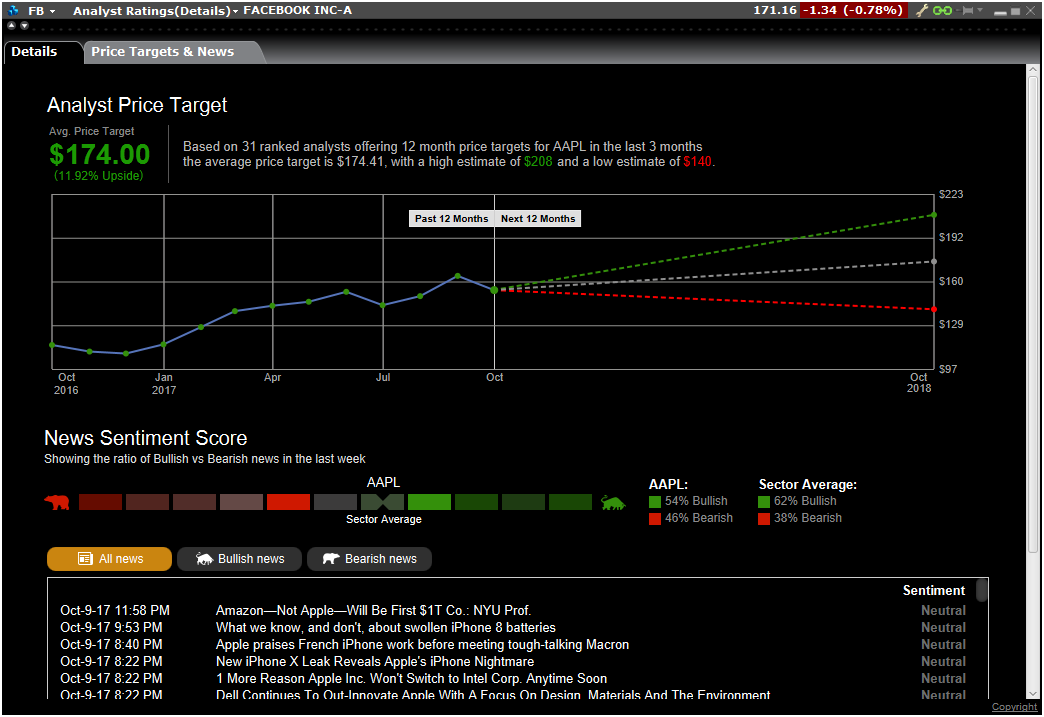
We now offer Tip Ranks fundamental analysis for U.S. stocks, available through new tabs in the Analyst Ratings (Summary) and Analyst Ratings (Details) windows. To access these features, right-click a U.S. stock and select Analytical Tools and then Company Fundamentals. In the Fundamentals blade next to the stock symbol, use the drop down list to select the Analyst Ratings (Summary) or Analyst Ratings (Details) window.
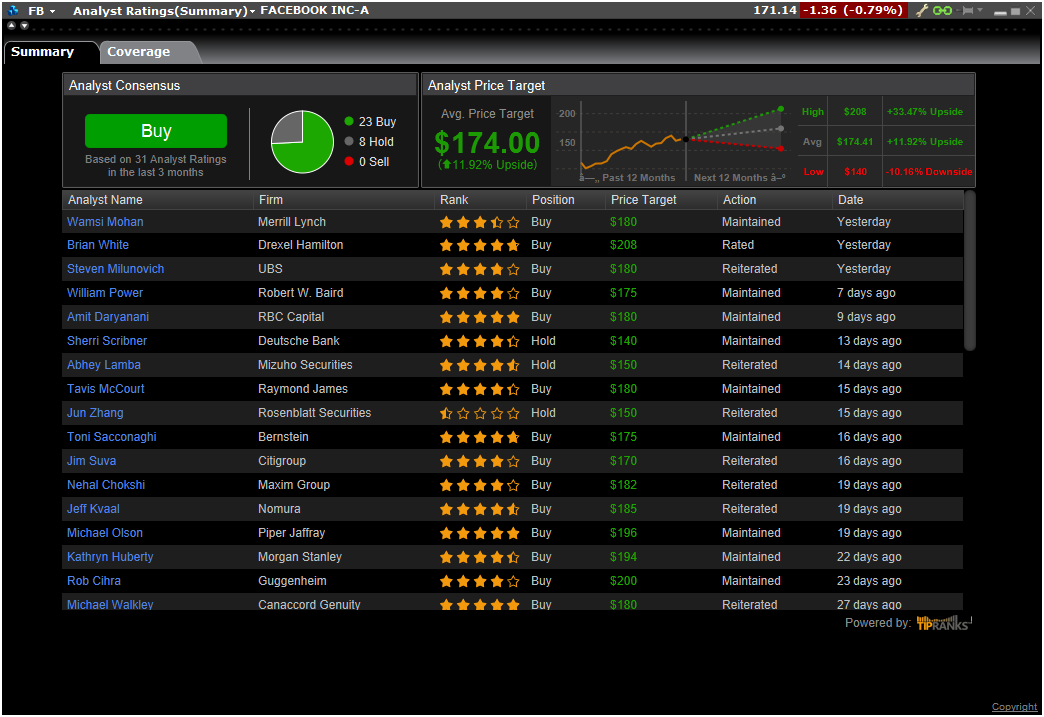
The Summary page now shows two tabs: Summary is the original view, and Coverage is the new Tip Ranks view. See the Analyst Consensus and its breakdown, the Analyst Price Target, and a list of analysts.
The Details page also shows two tabs: the original view in the Details tab, and Tip Ranks data in the Price Targets & News tab. See the Analyst Price Target along with New Sentiment Score, which shows the ratio of Bullish to Bearish news in the past week. Select a new headline to view the full article.
Real-time Tick-by-Tick Data in Time & Sales
The Time & Sales windows will now use real-time last tick data for all products that support this feature, which includes stocks and futures worldwide. All other products will continue to show real-time Time & Sales derived from the aggregated real-time volume. If you prefer to use real-time aggregated/averaging of trades (approximately every 3-4 seconds) instead of tick-by-tick data for all products, go to Global Configuration > Information Tools > Time & Sales > Settings, and check "Always use real-time volume to approximate Time and Sales data."
The IB API beta in conjunction with TWS version 969+ also supports this feature through the new reqTickbyTickData function which provides real-time data for up to five (5) US securities.
3D Volatility Surface Webtool
You can now view Implied Volatility in 3D using the 3D Volatility Surface webtool accessible from within the Implied Volatility Viewer. Simply click the "3D" button to study the model volatility surface of contracts in 3D! Display the model surface together with individual option IV points, or compare the current surface with any historical value by plotting them together. Click and drag the plot to rotate the view, and scroll within the plot to zoom. Expand the "Extra plot controls" to show contour and value lines and manipulate scaling using sliders.

More enhancements to the IB Risk Navigator include:
- The ability to open the Implied Volatility Viewer using the right-click "Charts" menu from any instrument line, and from with Risk Navigator using the right-click menu from any instrument.
- Two new columns, "Adjusted Vega" and "Custom Adjusted Vega" which can be added from the Metrics > Position Risk menu. The Adjusted Vega multiplies the Vega by an in-house term structure function. The custom adjusted vega (Vega x T-1/2) multiplies the Vega by the inverse square root of the number of calendar days to expiry.
- For single account users, you can now enable "Group legs into complex positions" from the Settings menu to view named strategies in reports.
- What-ifs: You can now add borrowing power and Debit card spending limit estimations to the dashboard view from the View menu, and you can remove unresolved positions from the right-click context menu of the Not Included list.
ERIS Swap Futures Available for Trading
US client accounts that have US Futures trading permissions can now trade swap futures on the Eris Exchange in TWS. In addition to having US Futures trading permissions, you must also subscribe to "ERIS Market By Order" market data in Account Management. We currently offer four Eris swap futures for trading: ZA9102 with maturities of 2019 DEC and 2020 MAR, and ZB9105 with maturities of 2022 DEC and 2023 MAR. When you add Eris futures contracts to your watchlist they are displayed using the maturity date.